Monitoramento de rede com o Bandwidthd
Dica publicada em Linux / Introdução

Monitoramento de rede com o Bandwidthd
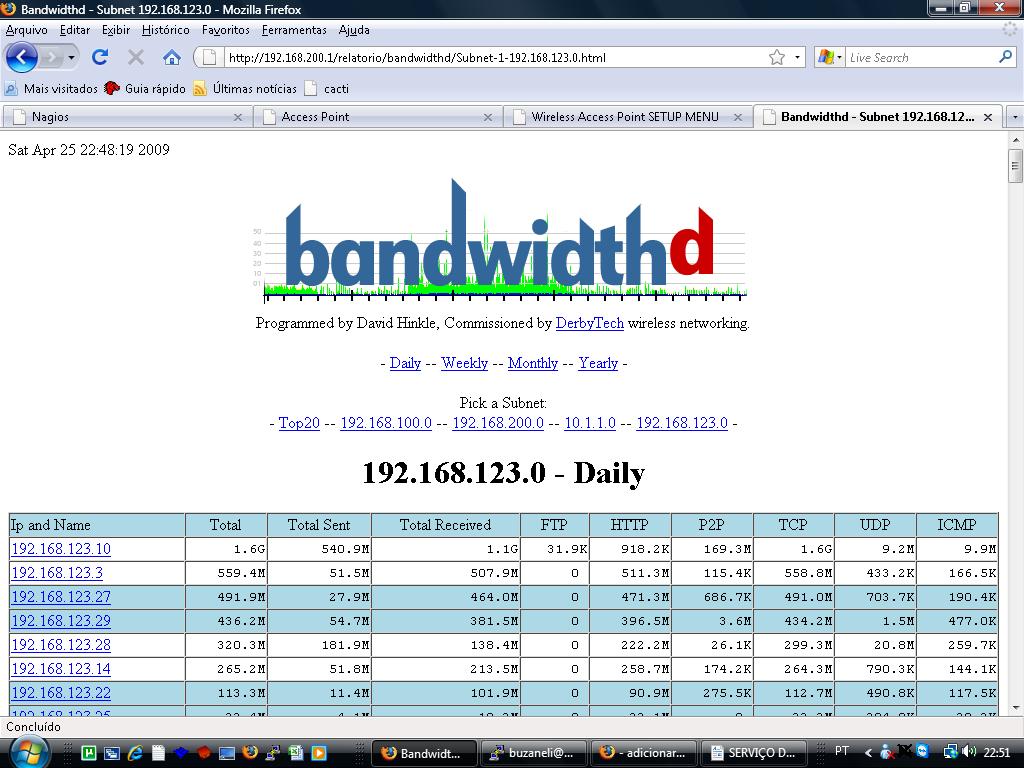
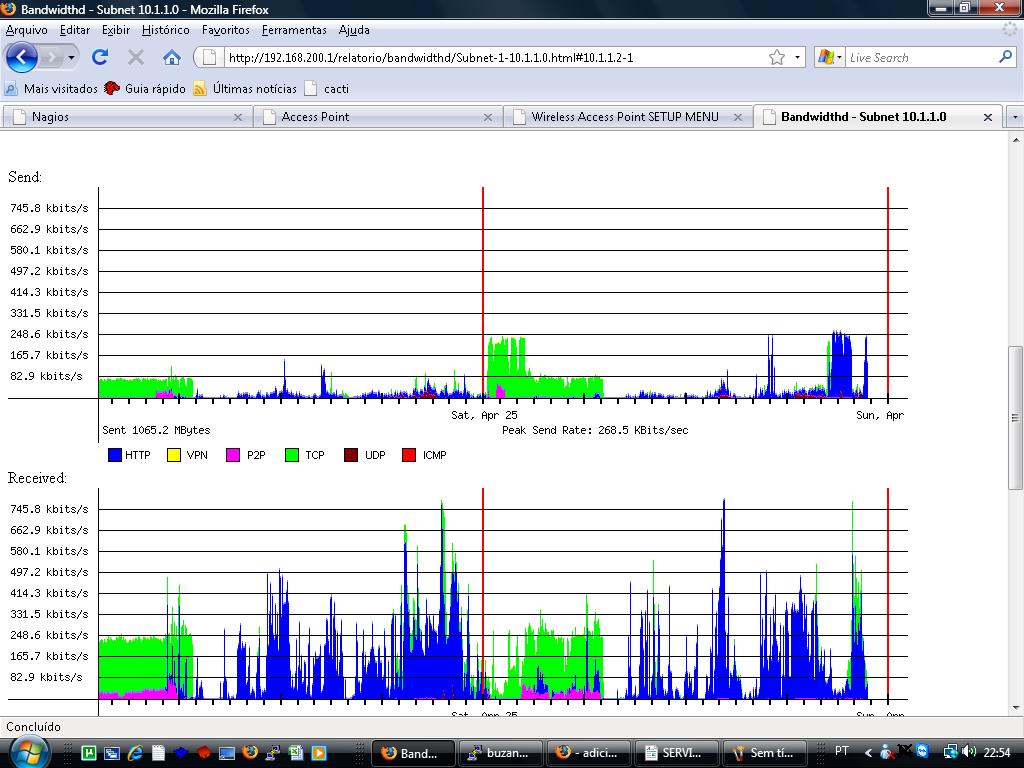
Esse monitoramento de rede serve para ver quais sãos os protocolos que estão sendo mais usados e ver o consumo de banda de cada host na rede, ele gera um gráfico muito bom e através desse gráfico você fica com uma visão melhor da sua rede para fazer um controle de banda ou QOS.
Instalação dos programas necessários:
1. O bandwidthd monitora os protocolos acessados pelas maquinas da rede, ele deve ser instalado no gateway da rede.
2. Instale o servidor Apache e o bandwidthd:
# apt-get install apache2 bandwidthd
Configuração do Bandwidthd:
3. Vamos agora para a configuração do bandwidthd.
3.a. Com o seu editor predileto vamos com figurar o bandwidthd.
# mcedit /etc/bandwidthd/bandwidthd.conf
# mkdir /var/www/bandwidthd
# chmod 775 -R "/var/www/bandwidthd
# /etc/init.d/bandwidthd stop
# /etc/init.d/bandwidthd start
3.b. Agora é só acessar o seu servidor pela web.
http://localhost/bandwidthd
Veja como fica o gráfico nas imagens abaixo:
Instalação dos programas necessários:
1. O bandwidthd monitora os protocolos acessados pelas maquinas da rede, ele deve ser instalado no gateway da rede.
2. Instale o servidor Apache e o bandwidthd:
# apt-get install apache2 bandwidthd
Configuração do Bandwidthd:
3. Vamos agora para a configuração do bandwidthd.
3.a. Com o seu editor predileto vamos com figurar o bandwidthd.
# mcedit /etc/bandwidthd/bandwidthd.conf
# Bandwidthd.conf
#
# Commented out options are here to provide
# documentation and represent defaults
# Subnets to collect statistics on. Traffic that
# matches none of these subnets will be ignored.
# Syntax is either IP Subnet Mask or CIDR
#subnet 192.168.0.0/24
#nessa opção aqui eu coloquei as rede a ser monitoradas
subnet 192.168.100.0/24
subnet 192.168.200.0/24
subnet 10.1.1.0/24
subnet 192.168.123.0/24
# Device to listen on
# Bandwidthd listens on the first device it detects
# by default. Run "bandwidthd -l" for a list of
# devices.
#dev "eth0"
#nessa opção está any, pois é para todos as interfaces
dev "any"
###################################################
# Options that don't usually get changed
# An interval is 2.5 minutes, this is how many
# intervals to skip before doing a graphing run
#skip_intervals 0
# Graph cutoff is how many k must be transfered by an
# ip before we bother to graph it
graph_cutoff 1024
#Put interface in promiscuous mode to score to traffic
#that may not be routing through the host machine.
#promiscuous true
promiscuous false
#Log data to cdf file htdocs/log.cdf
#output_cdf false
output_cdf true
#Set the cdf log output directory
log_dir "/var/lib/bandwidthd"
#Read back the cdf file on startup
#recover_cdf false
recover_cdf true
#Libpcap format filter string used to control what bandwidthd see's
#Please always include "ip" in the string to avoid strange problems
#filter "ip"
#Draw Graphs - This default to true to graph the traffic bandwidthd is recording
#Usually set this to false if you only want cdf output or
#you are using the database output option. Bandwidthd will use very little
#ram and cpu if this is set to false.
#graph true
#Set META REFRESH for static pages in seconds(default 150, use 0 to disable).
#meta_refresh 150
meta_refresh 150
#Set the static html output directory
#aqui eu escolhi o diretório para publicação da web
htdocs_dir "/var/www/bandwidthd"
# mkdir /var/www/bandwidthd
# chmod 775 -R "/var/www/bandwidthd
# /etc/init.d/bandwidthd stop
# /etc/init.d/bandwidthd start
3.b. Agora é só acessar o seu servidor pela web.
http://localhost/bandwidthd
Veja como fica o gráfico nas imagens abaixo: